
The Swiss CIO Barometer 2022: results and analysis
When the Swiss CIO Barometer was launched in 2015, our common objective was, together with our partners Finnova AG and the IFZ of the Lucerne University of Applied Sciences and Arts, to provide a forward-looking vision of the strategies implemented by the IT departments of the Swiss banks. This repeated picture of the market situation is now an integral part of the study that IFZ published a few weeks ago. Here are some extracts of the last survey. |


Survey conducted by
Dr. Thomas Ankenbrand
Institute of Financial Services Zug
Lucerne School of Business
with
Denis Bieri
Institute of Financial Services Zug
Lucerne School of Business
and
Moreno Frigg
Institute of Financial Services Zug
Lucerne School of Business
Introduction
The sixth edition of the CIO Barometer survey was conducted at the end of 2021. This survey aims to gather information on current trends and developments in the Swiss banking market. The CIOs of the Swiss banks were asked about the challenges they face and the extent to which these are being addressed at a strategic and operational level. The questions were posed in such a way that the present was mapped and a forecast for the future could be made. The structure was kept similar to the previous surveys in order to maintain comparability.
At the beginning of December 2021, a total of 232 representatives from the IT departments of Swiss banks were written to and asked to complete the survey. 51 complete questionnaires were returned, which corre- sponds to a response rate of 22 percent. The majority of the responding banks are regional banks, savings banks, and the Raiffeisenbank, which is grouped as a single institution. With 22 percent, the cantonal banks are the second largest banking group that participated in the survey. The remaining survey participants include foreign, private, and other banks. Big banks did not participate in the survey.
The IT Balanced Scorecard
The concept of IT balanced Scoreboard
Digitalization and technological progress pose challenges for today’s banks, especially in the field of information technology. Banks are affected by technology on the following fronts (Capgemini & Linkedin, 2018):
- New business models
- Faster and more efficient service
- Transparency and free services
- Personalization
- Pressure on margins and fees
- Predictive modelling and advanced data analytics
- Innovative distribution models
- Access to unserved/underserved segments
- Operational efficiency
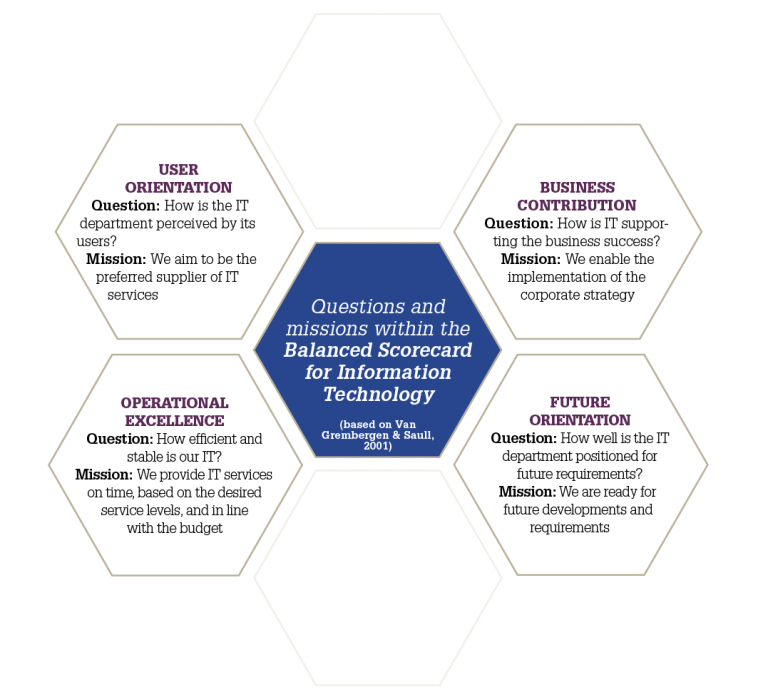
In order to efficiently structure the different dimensions of a bank’s IT department, we applied the IT Balanced Scorecard concept by Van Grembergen and Saull (2001), which is based on the original balanced scorecard approach from Kaplan and Norton (1996). Rather than focusing solely on financial targets, the scorecard seeks to develop and monitor a balanced set of nonfinancial measures too, such as the regard for customers, processes, or the degree of innovation.
The four dimensions of the IT balanced scorecard applied for this analysis include:
- User Orientation
- Business Contribution
- Operational Excellence
- Future Orientation
which again contain three subtopics each. In general, the dimension User Orientation covers the user perception of the IT department, whereas Business Contribution aims to measure its value creation. Operational Excellence deals with the efficiency and effectiveness of IT processes and Future Orientation examines processes and resources required to ensure innovation capabilities. The IT balanced scorecard is suitable to determine and describe strategic directions of a bank’s IT department and was thus chosen as the structural framework of the survey.
Chart 1 – The Business Contribution dimension (average: 3.24)
Chart 3 – The Future Orientation dimension (average: 2.88)
The survey results for the four different mentioned dimensions are shown in charts 1 to 4. With an average value of 3.24, the dimension Business contribution (Chart 1) is the highest priority, followed by Operational excellence (Chart 2) with a value of 3.18. The dimensions Future orientation (Chart 3) and User orientation (Chart 4) both achieve a value below 3, whereby the latter, with a value of 2.63, has a lower value than the former with 2.88. In comparison to the assessment from the 2021 survey, some differences can be observed. For example, the value for User orientation decreased by 0.21 points. All other dimensions, however, showed growth. It is noteworthy that Future orientation, with a plus of 0.32 points, became considerably more important compared to the previous year: Business contribution with 0.14 points and Operational excellence with 0.12 points also show positive growth. However, it should be noted that the changes could also be influenced by the adjustments in the wording of the indicators. In general, however, Swiss banks seem to be fairly consistent in their beliefs about the role of technology for their business.
With regard to the individual indicators, it becomes apparent that “IT security” is the leading indicator across all dimensions, with an average score of 3.80. Compared to last year’s results, the proportion of participants attributing a very high priority to this indicator increased from 56 percent to 80 percent. This proportion also exceeds the value from two years ago (74%).
Chart 2 – The Operational Excellence dimension (average: 3.18)
Chart 4 – The User Orientation dimension (average: 2.63)
It is also noteworthy that the indicator “Digitisation / optimisation of business processes”, with a value of 3.33, has displaced the indicator “Adaption of new regulatory requirements” (3.25) in second place among the most prioritised indicators. Other important indicators are “Client experience / usability” (3.27), “Implementation / improvement of products and services” (3.14), “Secure and develop required resources (staff & skills)” (3.08), and “Optimisation of operating mod- els and sourcing strategies” (2.98).
The least prioritised indicator is “Embedded finance” with a value of 2.02. This is also the reason why the average value of User orientation has decreased year-on-year. There is a bigger gap to the next indicators “Development of ecosystem/composability of the systems” and “Omni-Channel distribution” with values of 2.51 and 2.59, respectively. Last year, these two indicators were also assigned comparably low values.
Both indicators however, are expected to grow in importance for the foreseeable future. The expected priority score, assessed for five years ahead of when the survey took place, increases for both indicators by 0.61 and 0.39 points, respectively. The banks therefore assume that the relevance of financial ecosystems and the importance of omni-channel distribution will increase in the future.
Chart 5 – Priority averages of the four dimensions over time
Chart 5 provides an overview of the temporal development of the average scores per dimension of the IT Balanced Scorecard. The expected average score in 2026 is derived from this year’s survey participants’ expected priority that each underlying indicator will have in five years time. The average importance of all dimensions is anticipated to be higher in five years. This expectation was already evident in last year’s study. When looking at the individual dimensions, it is noticeable that User orientation shows a slight decrease in its average score since 2019. But on a five-year view it shows the largest increase in importance (+0.45), driven by the comparably high growth in the indicators “Embedded finance” (+0.67), “Omni-channel distribution” (+0.39), and “Client experience/usability” (+0.32).
Likewise, according to the survey, the dimension Future orientation will also become significantly more important, again driven be the increase in priority for all underlying indicators. As already mentioned, the indicator “Development of ecosystem/composability of the systems” in particular is expected to gain in importance (+0.61). In the two currently most important dimensions, i.e., Business contribution and Operational excellence, the indicators “Digitisation/optimisation of business processes” (+0.20) and “Reduction of IT operation costs” (+0.20) increased the most, although less strongly than those with the greatest increase in priority across all four dimensions of the IT Balanced Scorecard.
Like in last year’s survey, the only indicator that is expected to lose importance in the future is “Adaption of new regulatory requirements” (-0.03). Furthermore, the indicator with the highest priority today, i.e., “IT security”, will only see a marginal change in priority in five years’ time (+0.06) and will thus remain a top priority for Swiss banks in the long term. The evaluation of the indicators in this year’s CIO Barometer shows that Swiss banks see the greatest future increase in relevance in the areas of “Embedded finance”, “Development of ecosystem/composability of the systems”, and “Omni-channel distribution”. The first two developments in particular are likely to require certain IT skills from the banks for planning and successful implementation and are also likely to be accom- panied by changes in the current IT infrastructure at Swiss banks.
Development of IT related costs
Chart 6 – Cost of labor
Chart 7 – General and Administrative costs
Chart 8 – Run the Bank vs Change the Bank
Chart 6 and 7 show the banks’ cost allocations and the fractions associated to information technology. The costs structure at Swiss banks can be used as a reference point to estimate their IT capacities. The temporal development of the proportions of IT costs in the banks’ labour costs (left-hand graph) and general and administrative costs (right-hand graph) are highlighted in Figure 8.4. The graph on the left-hand side reveals that only 16 percent of labour costs are affiliated with information technology. This is exactly the same percentage distribution as in the last year and only slightly higher than in the year 2019.
On the contrary, general and administrative costs, as shown in the right-hand graph of Figure 8.4, are driven significantly by expenses for information technology. At the end of 2021, these accounted for around 37 percent, a share that has declined slightly in each of the last two years. The larger share of IT-related costs in general and administrative costs compared to the share in labour costs could potentially be explained by a relatively high degree of outsourcing at Swiss banks. This in turn could indicate that the trends that banks consider more important for the future, such as open financial ecosystems or embedded finance, cannot be driven internally by the banks themselves, but can only be implemented in cooperation with specialised third-party partners.

Chart 8 highlights the percentage of IT costs related to innovative activities (”change-the-bank”) and related to ensuring operational activity (“run-the-bank”) at Swiss banks. Possible answers range from 100 percent change-the-bank and zero percent run-the-bank to the opposite, zero percent change-the-bank and 100 percent run- the-bank. The figure reveals that 43 percent of the participating banks spend 80 percent of their IT costs on ongoing operations. Two-fifths of the participants have a mix of 60 percent run-the-bank and 40 percent change-the-bank. The remaining 16 percent invest more in innovative activities than for operational business and thus have a distribution of 60 percent change-the-bank and 40 percent run-the-bank. No bank focuses 100 per cent on run-the-bank or change-the-bank.
Compared to last year’s results, the banks are focusing more on run-the-bank activities again this year. Given banks’ priorities for more innovative distribution, interaction, and operating models, the relatively low innovation capacity could be a barrier to im- plementation. This suggests that banks will not develop the solutions themselves, but will adopt and inte- grate existing operational solutions from third parties such as platform providers for financial ecosystems.
Methodology and Statistical information
The three charts displayed here provide an overview of all the participating banks:
in Chart 9, banks are segmented into bank groups. The majority of the responding banks (43%) are regional banks, savings banks, and the Raiffeisenbank, which is grouped as a single institution. With 22 percent, the cantonal banks are the second largest banking group that participated in the survey. The remaining survey participants include foreign, private, and other banks. Big banks did not participate in the survey.
Chart 10 shows the distribution of participating banks with regard to the volume of the balance sheet. Almost three-fifths (57%) of the banks that participated in the survey have a balance sheet volume of less than CHF 3 billion. Medium sized banks make up 28 percent, and 12 percent of the participating banks have a balance sheet volume between CHF 25 billion and 50 billion. Two participants, or four percent in relative terms, have a balance sheet of over CHF 50 billion.
Chart 11, presenting the proportions according to assets under management, shows that this is roughly the same distribution as the balance sheet volume. More than half (55%) of the participants manage less than CHF 3 billion assets, while 28 percent are in a range between CHF 3.0 billion and 24.9 billion. 18 percent of all participants have more than CHF 25 billion assets under management.
Chart 9 – Bank groups (%)
- Cantonal Banks
- Regional & savings banks, Raiffeisen
- Foreign Banks
- Private Banks
- Other banks
Chart 10 – Balance sheet sizes (%)
- Less than CHF 1 bn
- From CHF 1 bn to 2,9 bn
- From CHF 3 bn to 9,9 bn
- From CHF 10 bn to 24,9 bn
- From CHF 25 bn to 49.9 bn
- CHF 50 bn and more
Chart 11 – Assets under Management (%)
- Less than CHF 1 bn
- From CHF 1 bn to 2,9 bn
- From CHF 3 bn to 9,9 bn
- From CHF 10 bn to 24,9 bn
- From CHF 25 bn to 49.9 bn
- CHF 50 bn and more